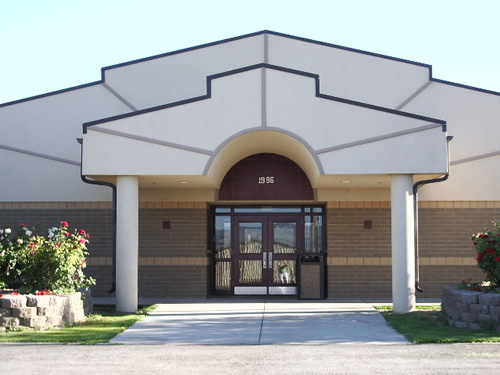
Based on raw demographics, Murtaugh is an unlikely place to find a standardized test success story.
A tiny school district in the Magic Valley, about 20 miles east of Twin Falls, Murtaugh faces many of the same challenges that are widespread in rural Idaho. Enrollment has rebounded — but it remains slightly less than 300, and virtually unchanged since 2000. In 2015-16, 71 percent of Murtaugh’s students qualified for free and reduced-price lunch.

Yet last week, when the state released spring 2016 standardized test results, the Murtaugh School District landed well above the state average. What’s more, Murtaugh’s scores improved markedly from 2015, the first year of Idaho’s Smarter Balanced Assessment Consortium online exam.
District Superintendent Michele Capps sees this year’s numbers in a broader context.
“What we do is really not just so we will do well on the SBAC,” said Capps, who doubles as principal at Murtaugh’s year-old elementary school. “The SBAC results are simply a nice outcome to what we would do every day.”
In the second year of the SBAC, Idaho scores improved slightly — in both English language arts and math, and from third grade through high school scores. But the 2016 scores also followed an old pattern: a relationship between test scores and demographics.
Idaho Education News analyzed the 2016 SBAC scores against free and reduced-price lunch eligibility — a statistic widely used to gauge student poverty.
The analysis revealed a significant negative correlation between poverty and SBAC scores. In other words, schools with higher poverty rates tended to score lower on the SBAC, and vice versa.
The analysis does not reveal a causal link between poverty and student performance. It only reveals a statistical relationship between the two variables.
Charter performance
Schools and districts are assigned an SBAC proficiency rate based on the percentage of students who scored “advanced” or “proficient” on the tests. The top performers, overwhelmingly, were charter schools. Charter schools accounted for the top 10 proficiency rates in math, and seven of the top 11 proficiency rates in English language arts.
But all of these high-performing charter schools also enjoy demographic advantages. None have free and reduced-price lunch eligibility rates of 49 percent or higher — the statewide average for 2015-16. Several of the charter schools offer no federally subsidized lunch programs at all, according to State Department of Education records.
The issue of charter school demographics is hardly a new one. In February, the state’s Public Charter School Commission issued a report that said charter schools are far less diverse than traditional public schools. The report cited low-income students as one of the groups underrepresented in charter schools.
The outliers
Nonetheless, several school districts defied the demographic trends — posting higher-than-average SBAC scores despite higher-than-average poverty rates.
These outliers included a handful of Idaho’s smallest districts, and its second-largest district.
The South Lemhi School District posted a 72 percent proficiency rate on the ELA portion of the test. No traditional district scored higher than the four-day school district based in remote Leadore — a district where 55 percent of students qualify for federally subsidized lunch.
Among other rural districts, Eastern Idaho’s West Jefferson School District beat the state average in math, while the Magic Valley’s Dietrich School District topped state averages in ELA and math.
The Boise School District also qualifies as an outlier. Its ELA and math scores exceeded the state’s averages, and 53 percent of the district’s students qualify for free and reduced-price lunch.
But the Boise district itself is diverse. The district’s highest performing schools on this year’s SBAC are located in the North End and East Boise — affluent neighborhoods with poverty rates that are just a fraction of the state and district averages.
The Murtaugh story
This spring, Murtaugh’s SBAC scores topped state averages — and the district’s recent results.
- Across all grades, 57 percent of students scored advanced or proficient on the ELA portion of the test. The statewide average was 53 percent.
- Murtaugh’s 47 percent proficiency rate in math topped the state average of 42 percent.
- Murtaugh posted the state’s biggest improvement in math; a year ago, only 30 percent of students scored advanced or proficient in the math portion of the SBAC. The improvement on the ELA was also considerable; in 2015, only 50 percent of the district’s students scored advanced or proficient.
Capps cannot point to one single factor to explain this year’s scores. She instead points to several ongoing initiatives — a preschool program supported through grants; all-day kindergarten that has been in place since 1996; and a technology initiative that provides devices to every student.
But the district consciously focused on its approach to math. The district reworked its math curriculum and its teaching methods, and each teacher is assigned a math coach.
“We have changed a great deal,” Capps said, “and (we) expect even more growth this year.”
